
Over the next decades, the population nationally and in most states will become older and more racially and ethnically diverse. As the demographics of the average New Yorker change over time, so will the demographics of the average patient. Although New York State is already one of the most diverse states in the country, it is not immune to disparities in health care access and quality by race and ethnicity, as the COVID-19 pandemic has underscored. The health care system will need to prepare for tomorrow’s changing patient population.
This NYHealth brief examines publicly available projections of county-level population estimates by age and race/ethnicity within New York State. It also provides insights on how demand for health care might change throughout New York State over the next decades. These projections highlight the increasing urgency for developing a health care system that is racially and ethnically sensitive and can meet the impending increase in demand, particularly by the growing minority and elderly populations.
Key Findings:
- New York State is projected to have lower population growth relative to the rest of the country.
- Most counties in New York State are projected to have decreases in population size. Those counties where population is expected to increase are largely located in and around New York City; this will increase the concentration of the State’s population in New York City.
- In 2019, the non-Hispanic white population represented a majority (55%) of the State’s population; however, the State is projected to become majority minority by 2035.
- The Hispanic population is projected to grow faster than the non-Hispanic Black and non-Hispanic white populations.
- In 2019, the proportion of the New York population that was 65 years or older was 16.4%. By 2035, one out of five New Yorkers is expected to be 65 years old or older. While the elderly population increases, there will be a decrease in the size of the child (ages 0–19) and working-age (ages 20–64) populations.
- All counties in the State are projected to experience an increase the proportion of the population that is elderly.
- These demographic shifts have the potential to exacerbate existing health disparities by race and ethnicity, as well as to strain a health care system that already experiences shortages in health care professionals in parts of the State. Addressing these issues will require a multi-pronged approach, including workforce training and recruitment efforts.
- Given that demographic distributions can vary substantially across counties, it will also be critical for local health planners to develop tailored plans to meet the changing health care needs of their populations.
Executive Summary
It is well known that the population nationally and in most states is getting older. Many states’ populations are also growing more racially and ethnically diverse. These demographic shifts will intensify over the coming decades.
This data brief examines projections of county-level population estimates by age and race/ethnicity within New York State. As the demographics of the average New Yorker change over time, so will the demographics of the average New York patient. The health care system will need to prepare for tomorrow’s changing patient population.
Although New York State is already one of the most diverse states in the country, it is not immune to disparities in access and quality of care by race and ethnicity. With projections that New York will likely become majority minority by 2035, addressing those disparities and improving the social determinants of health that disproportionately affect minority communities will only increase in importance.
Projections also show a steady increase in the relative size of the elderly population over the next decades, at an even faster rate than the increase in the minority population. Moreover, unlike the minority population, which will remain largely concentrated in the highly urban areas of the State over the foreseeable future, the aging of the population will be felt throughout the State, including in rural counties. The elderly have historically been the heaviest users of health care in New York, and the health care system must prepare for their growing numbers. The growing elderly population will also be coupled with a decrease in the working-age population, deepening challenges to financing the health care system, as well as challenges in recruiting and training a sufficient workforce to meet the increasing demand for care.[1]
The county-level population forecasts described in this brief offer insights on how demand for health care might change throughout New York State over the next decades. They highlight the increasing urgency for developing a racially and ethnically sensitive health care system, particularly in more urban parts of the State. The forecasts can also be used by State and county health administrators, as well as long-term care and other health system leaders, to help ensure that the supply of health care will be able to meet the impending increase in demand, particularly by the growing elderly population.
[1] The projections discussed in this brief do not account for the impact of the COVID-19 pandemic, which could affect the concentration of New Yorkers living in cities as well as distribution of the State population by age, race, and ethnicity.
Overall New York State Population
Overall Population Growth Projected to Be Stagnant
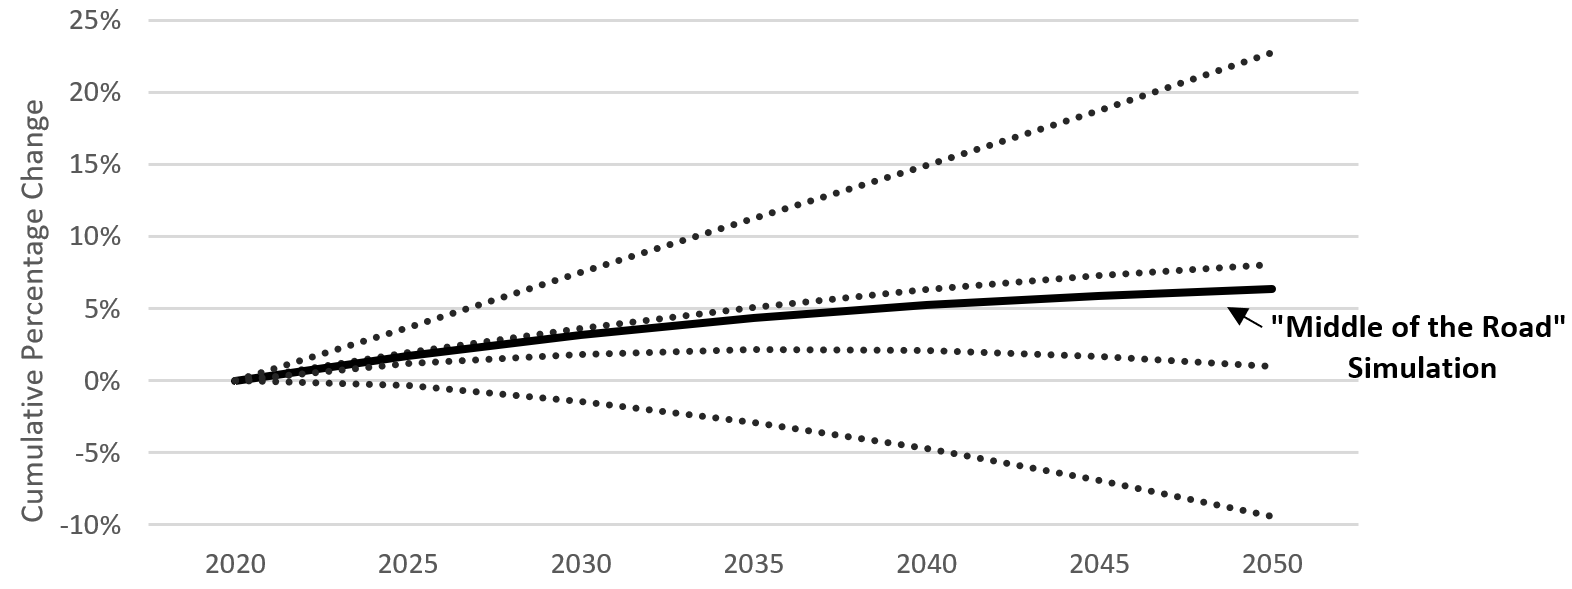
The total population in 2019 for New York State was estimated to be 19.5 million, according to the latest estimates by the U.S. Census.[1] Figure 1 displays five potential scenarios for the growth in the total State population from 2020 through 2050. These five scenarios are based upon various assumptions used for birth and mortality trends, climate change trends, and other factors (see Data section for more details on how forecasts were developed and Limitations section for a discussion of the uncertainty involved in the projections).
This brief examines the projections from the “Middle of the Road,” scenario, which is considered the most likely to occur. Based on the “Middle of the Road” scenario, total population for New York State is projected to show relatively little growth over time. New York’s population is expected to grow approximately 4% by 2035. By comparison, the U.S. population is expected to grow approximately 11% by 2035. All states adjacent to New York are also projected to experience population decline or below-average population growth through 2035, ranging from a 4% decline in Vermont to a 9% increase in Massachusetts.[2]
Figure 1. Cumulative Growth Projections in Total Population for New York State: 2020 – 2050 (5-year intervals)
Source: Hauer, M. E. (2019). Population projections for U.S. counties by age, sex, and race controlled to shared socioeconomic pathway. Scientific data, 6, 190005. Data available at: https://osf.io/9ynfc/.
[1] United States Census Bureau. QuickFacts. Available at: https://www.census.gov/programs-surveys/sis/resources/data-tools/quickfacts.html.
[2] United States Census Bureau. QuickFacts. Available at: https://www.census.gov/programs-surveys/sis/resources/data-tools/quickfacts.html.
Population By County
New York State’s Population Will Become Increasingly Concentrated in New York City
New York City accounted for about 43% (8.4 million people) of the State’s total population in 2018.[1]
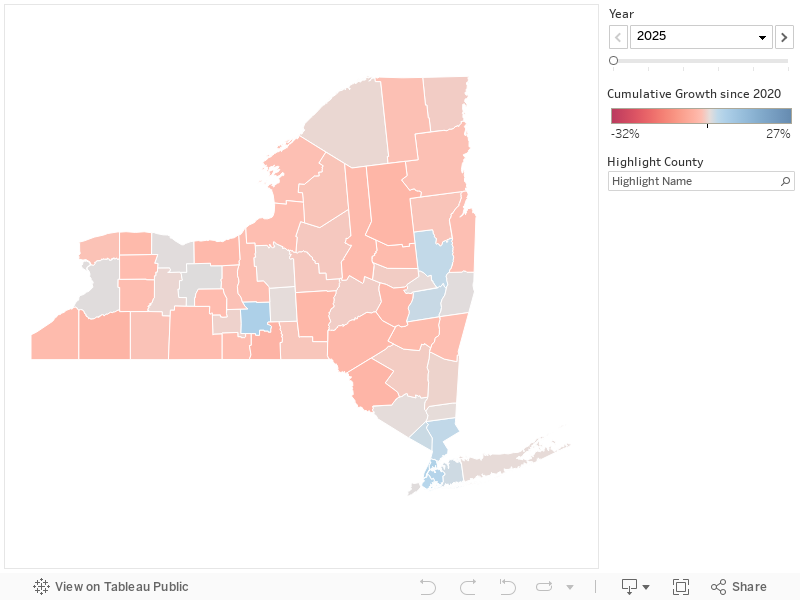
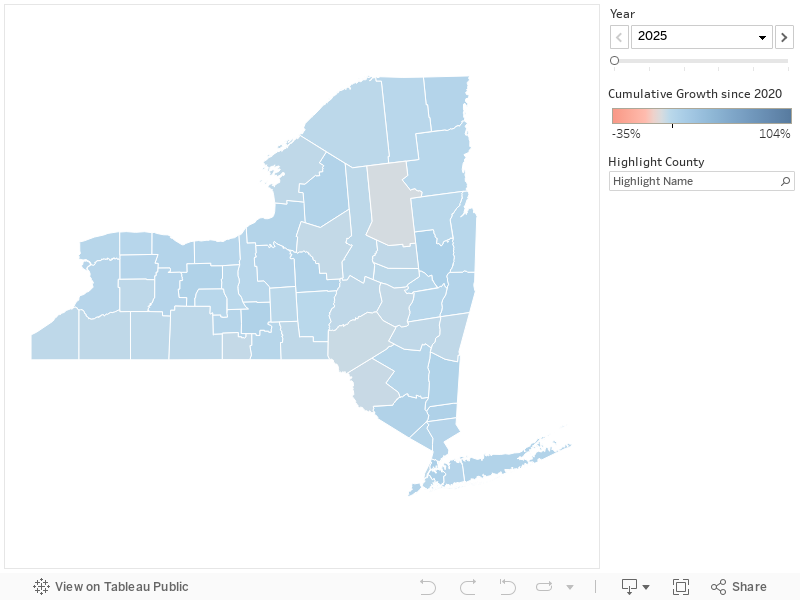
Over the coming decades, New York City will be one of the few locations in the State expected to experience population growth (Figure 2 ).
- Four of the five counties (Bronx, Kings, New York, and Queens) are expected to grow.
- Richmond is the only county in New York City expected to decrease in population size.
- Westchester, Rockland, and Nassau Counties (all adjacent to New York City), as well as Albany and one of its adjacent counties, Saratoga, along with Tompkins County, are the only other New York counties projected to have more than a 1% growth in their population by 2035.
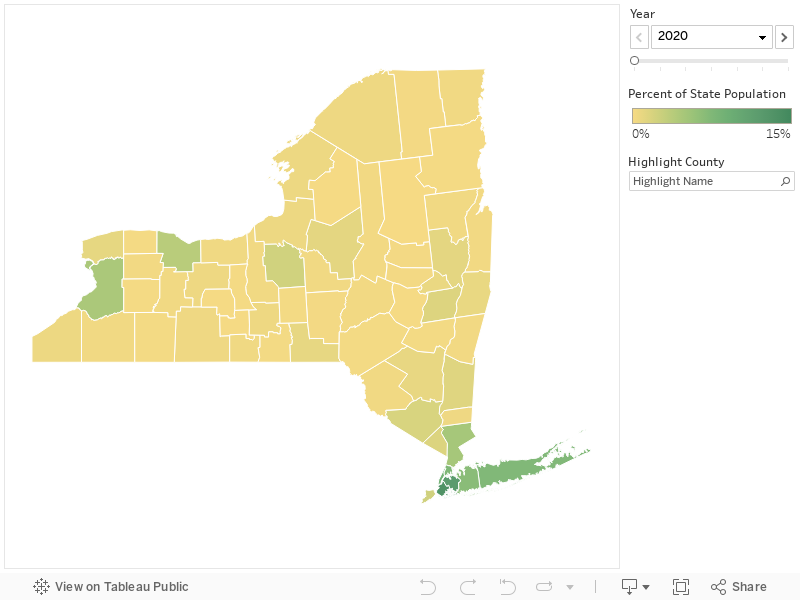
Under this projected scenario, New York City would account for more than half of the State’s population by 2050 (Figure 3 ).
Figure 2. Projected Cumulative Growth in Total Population by County for New York State: 2020 – 2050 (5-year intervals)
Source: Hauer, M. E. (2019). Population projections for U.S. counties by age, sex, and race controlled to shared socioeconomic pathway. Scientific data, 6, 190005. Data available at: https://osf.io/9ynfc/
Figure 3. Projected Distribution across Counties of the New York State Population: 2020–2050 (5-year intervals)
Source: Hauer, M. E. (2019). Population projections for U.S. counties by age, sex, and race controlled to shared socioeconomic pathway. Scientific data, 6, 190005. Data available at: https://osf.io/9ynfc/
[1] United States Census Bureau. QuickFacts. Available at: https://www.census.gov/programs-surveys/sis/resources/data-tools/quickfacts.html.
Minority Groups Projected to Be a Majority in New York State Within 15 Years
- In 2019, the proportion of the New York State population that was non-Hispanic white was 55% (“non-Hispanic white” is referred to as “white” for the rest of the brief).[1]
- According to the projections, New York and five other states (New Jersey, Florida, Georgia, Maryland, and Arizona) will become majority minority by 2035 (data not shown for other states).
- In 2019, five states (California, Hawaii, Nevada, New Mexico and Texas), as well as the District of Columbia, were already majority minority.[2]
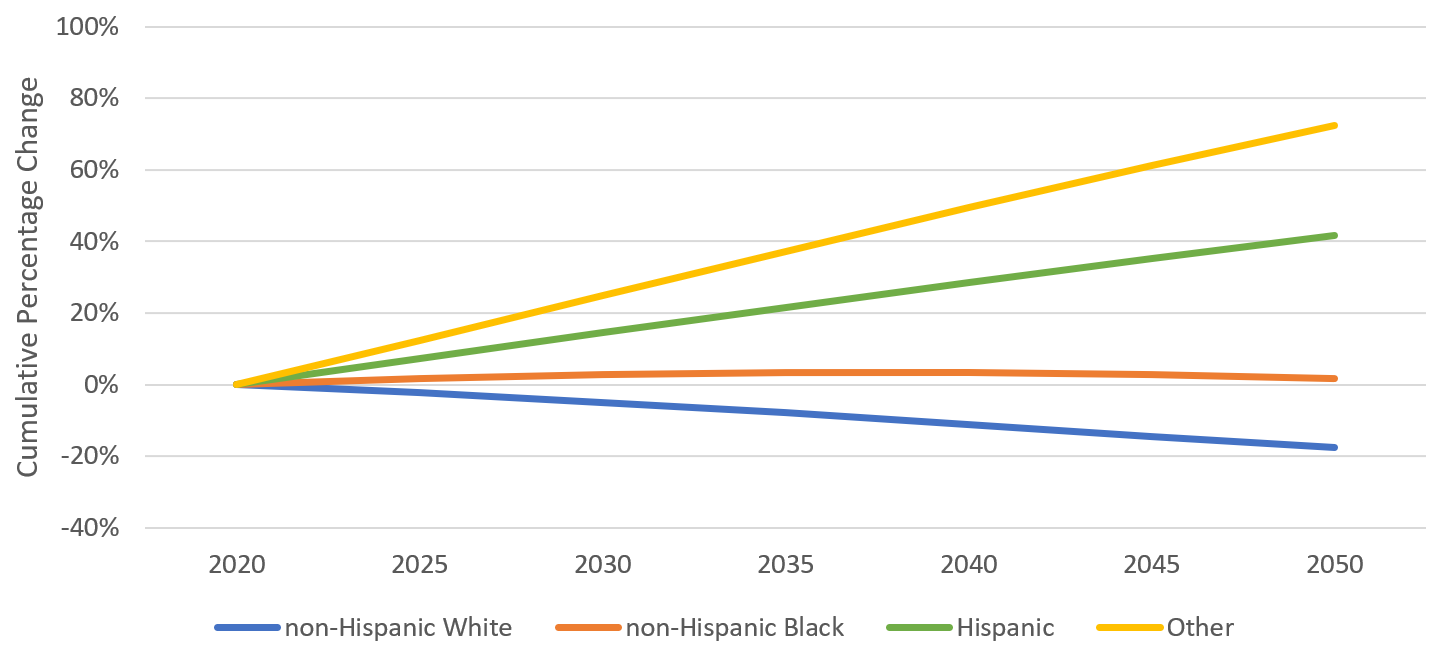
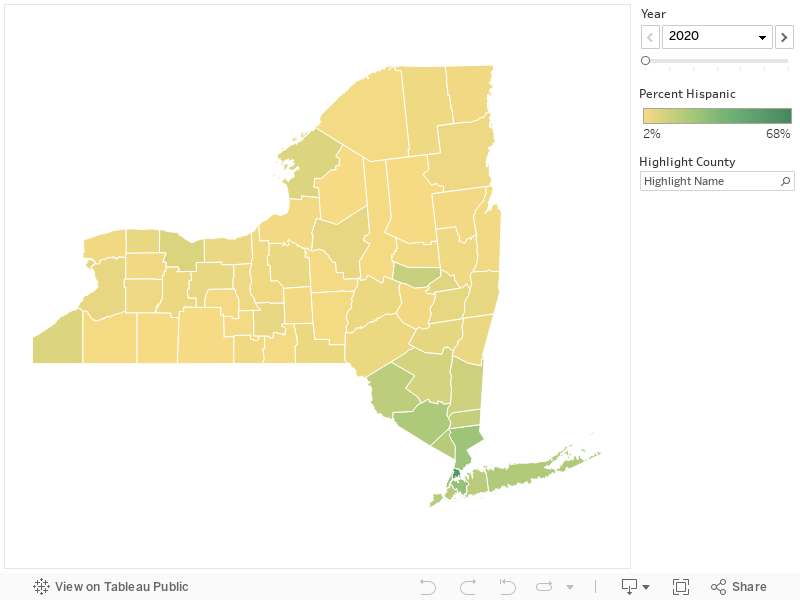
Throughout New York State, the minority population is expected to increase as the white population is expected to decrease (Figure 4). The number of white New Yorkers is expected to decrease steadily throughout the projection period, amounting to an 8% cumulative decline by 2035. By comparison, there is projected to be a steady increase in the number of Hispanic New Yorkers, amounting to an increase of more than 20% in the number of Hispanics by 2035. The number of non-Hispanic Black New Yorkers (“non-Hispanic Black” is referred to as “Black” for the rest of the brief) is projected to increase slightly (approximately 3%) by 2035.
There is also rapid growth expected for the “Other” race/ethnicity category, which includes non-Hispanic American Indian and Alaska Natives, Asians and Pacific Islanders. The “Other” racial/ethnic population, primarily driven by Asians, is expected to grow by more than 30% by 2035 and comprise nearly the same proportion of the State population as the Black population (13% compared to 15%) (Figure 5 ).
Figure 4. Projected Cumulative Growth in New York State Population by Race and Ethnicity: 2020–2050 (5-year intervals)
Source: Hauer, M. E. (2019). Population projections for U.S. counties by age, sex, and race controlled to shared socioeconomic pathway. Scientific data, 6, 190005. Data available at: https://osf.io/9ynfc/. “Other” category includes non-Hispanic American Indian and Alaska Native, Asian and Pacific Islander.
Figure 5. Projected Distribution in New York State Population by Race and Ethnicity: 2020–2050 (5-year intervals)
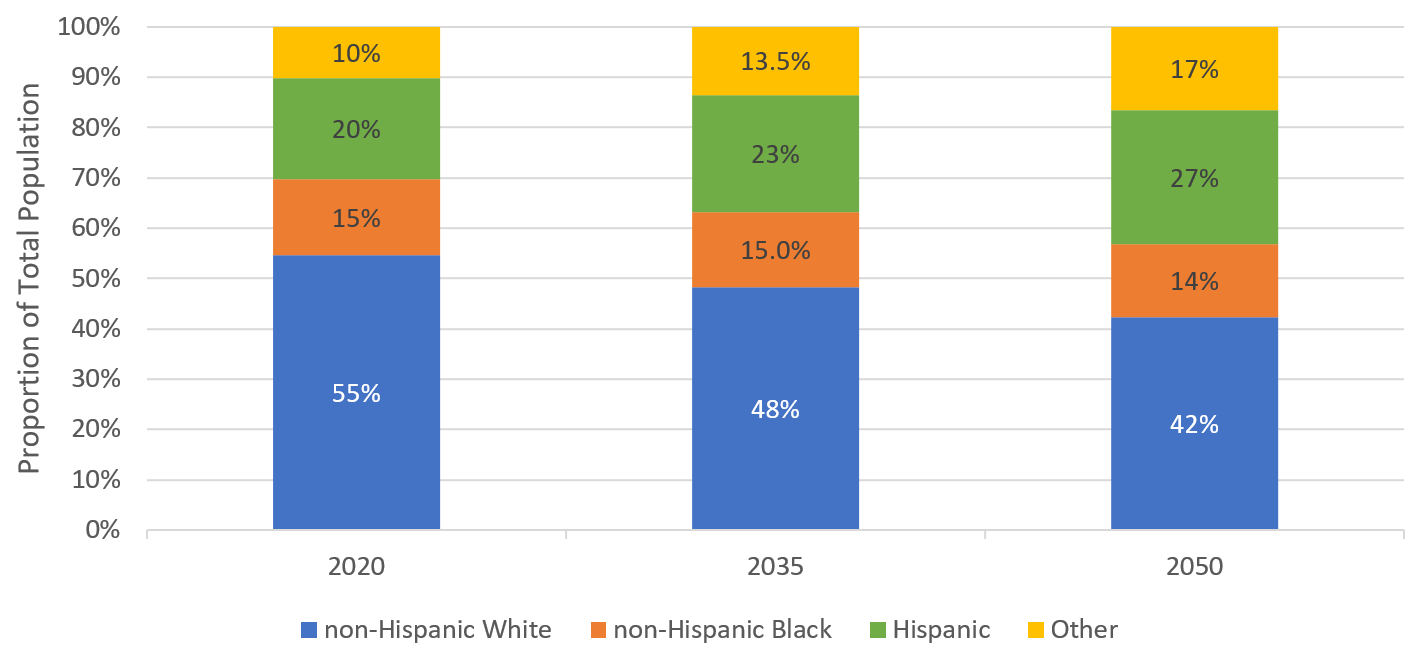
Source: Hauer, M. E. (2019). Population projections for U.S. counties by age, sex, and race controlled to shared socioeconomic pathway. Scientific data, 6, 190005. Data available at: https://osf.io/9ynfc/. “Other” category includes non-Hispanic American Indian and Alaska Native, Asian and Pacific Islander.
[1] United States Census Bureau. QuickFacts. Available at: https://www.census.gov/programs-surveys/sis/resources/data-tools/quickfacts.html.
[2] United States Census Bureau. QuickFacts. Available at: https://www.census.gov/programs-surveys/sis/resources/data-tools/quickfacts.html.
Projected Cumulative Growth and Distribution by Race/Ethnicity
Kings and New York Counties are the only two counties projected to have more than a 1% increase in the number of white New Yorkers through 2035 (Figure 6a). However, because of the growth of minority populations in the State (Figures 6b–6c), only Kings County is projected to have an increase in the proportion of the population that is white (Figure 7a).
Over the next 15 years, the largest percentage point increases in the proportion of the population that is a minority is projected to occur in Jefferson County (where currently nearly four in five residents are white) and Nassau County (currently nearly 60% white) (Figures 7b–7c).
At the county level, the most recent U.S. Census estimates show that four counties in New York City—Bronx, Queens, Kings, and New York— are majority minority.[1] By 2035, Nassau and Westchester Counties are also projected to be majority minority.
Figure 6a. Projected Cumulative Growth in Non-Hispanic White Population for Each County in New York State: 2020–2050 (5-year intervals)

Figure 6b. Projected Cumulative Growth in Non-Hispanic Black Population for Each County in New York State: 2020–2050 (5-year intervals)
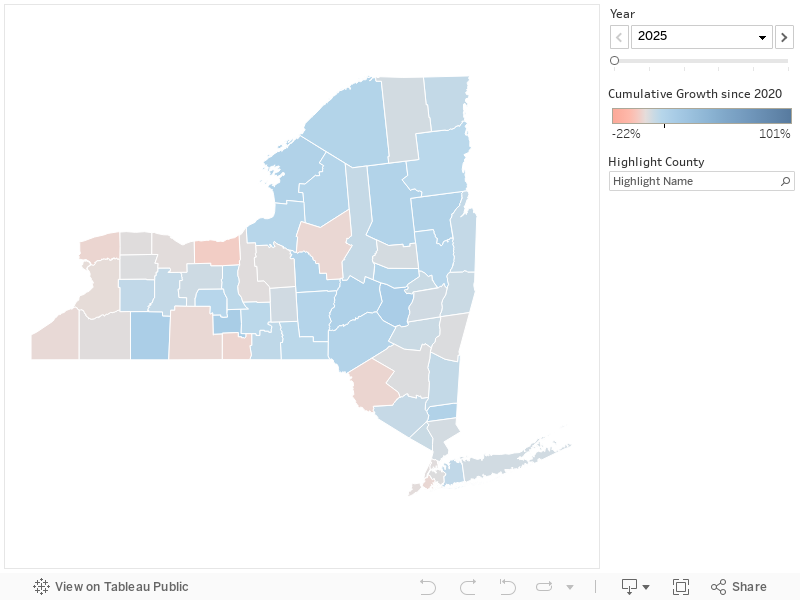
Figure 6c. Projected Cumulative Growth in Hispanic Population for Each County in New York State: 2020–2050 (5-year intervals)

Source: Hauer, M. E. (2019). Population projections for U.S. counties by age, sex, and race controlled to shared socioeconomic pathway. Scientific data, 6, 190005. Data available at: https://osf.io/9ynfc/
Figure 7a. Projected Distribution of Non-Hispanic White Population for Each County in New York State: 2020–2050 (5-year intervals)
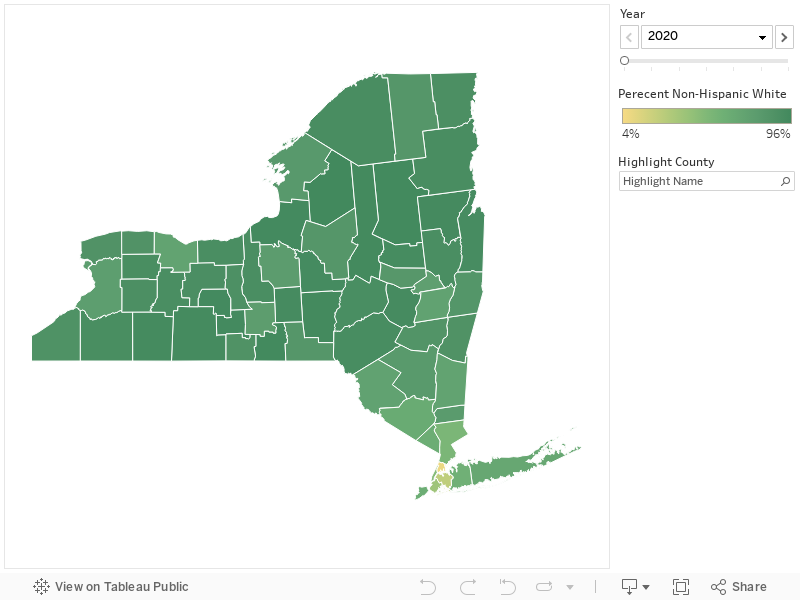
Figure 7b. Projected Distribution of Non-Hispanic Black Population for Each County in New York State: 2020–2050 (5-year intervals)
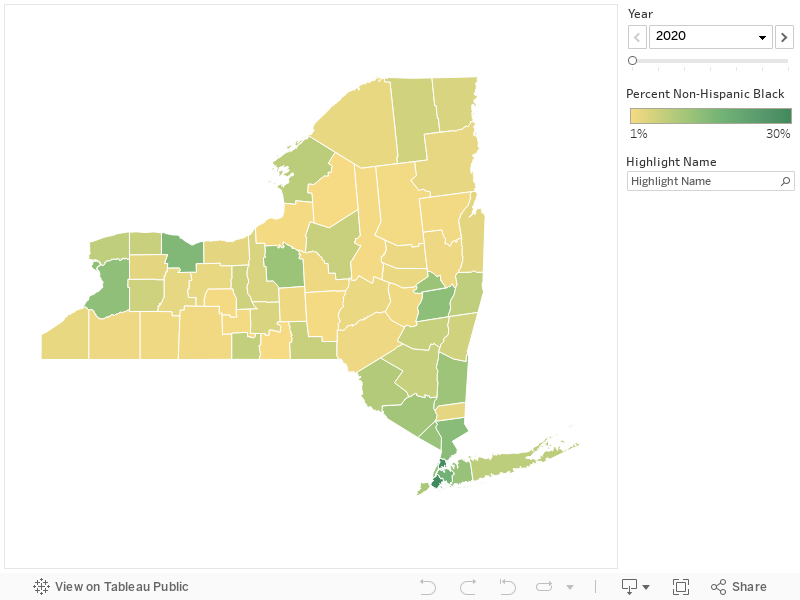
Figure 7c. Projected Distribution of Hispanic Population for Each County in New York State: 2020–2050 (5-year intervals)
Source: Hauer, M. E. (2019). Population projections for U.S. counties by age, sex, and race controlled to shared socioeconomic pathway. Scientific data, 6, 190005. Data available at: https://osf.io/9ynfc/
[1] United States Census Bureau. QuickFacts. Available at: https://www.census.gov/programs-surveys/sis/resources/data-tools/quickfacts.html. (Latest year of county-level data available is for 2018.)
The Elderly Population Is Projected to Increase in All Counties
In 2019, the proportion of the New York State population 65 years or older was 16.4%, slightly higher than the national proportion (16.0%).[1] The number of elderly New Yorkers will grow rapidly during the next decades, relative to the under-65 population (Figure 8). By 2035, one out of five New Yorkers is expected to be 65 years old or older (Figure 9). There will be a concurrent decline in the proportions of the population that are working adults (20–64) or children (0–19).
Figure 8. Projected Cumulative Growth in New York State Population by Age Group: 2020–2050 (5-year intervals)
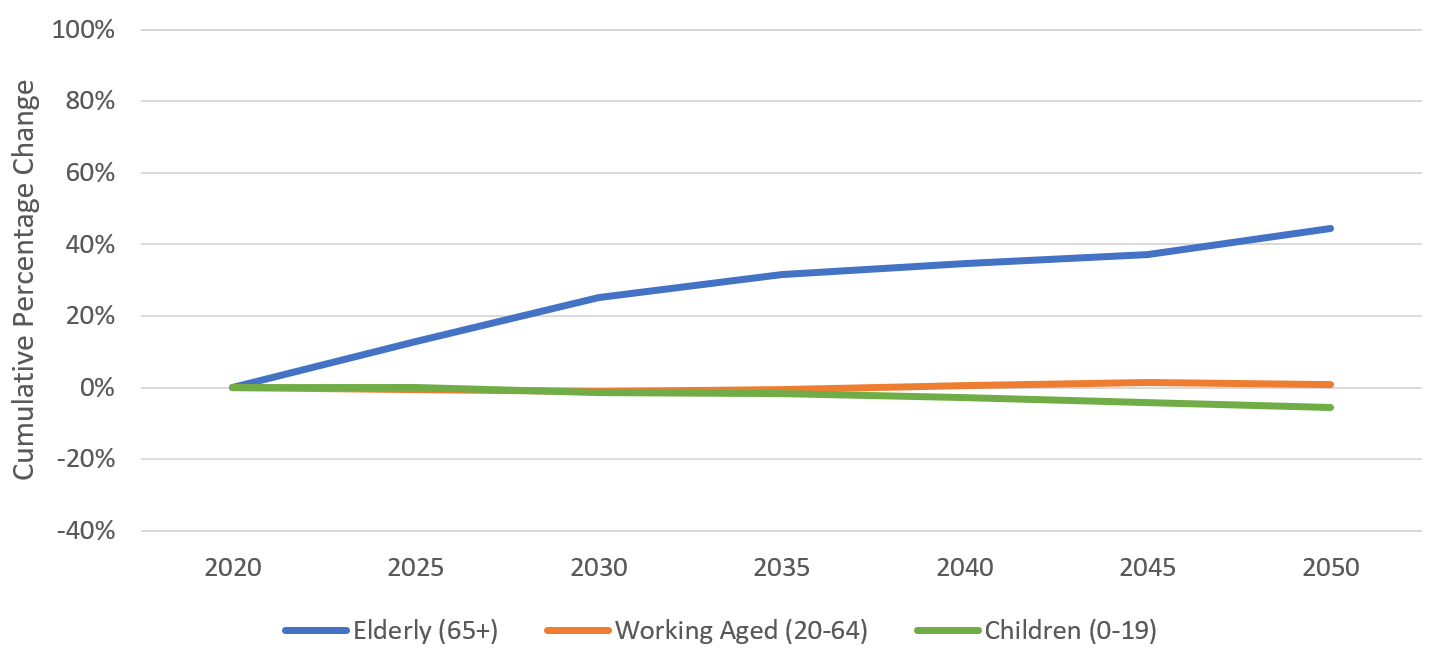
Source: Hauer, M. E. (2019). Population projections for U.S. counties by age, sex, and race controlled to shared socioeconomic pathway. Scientific data, 6, 190005. Data available at: https://osf.io/9ynfc/
Figure 9. Projected Shift in New York State Population by Age Group: 2020–2050 (5-year intervals)
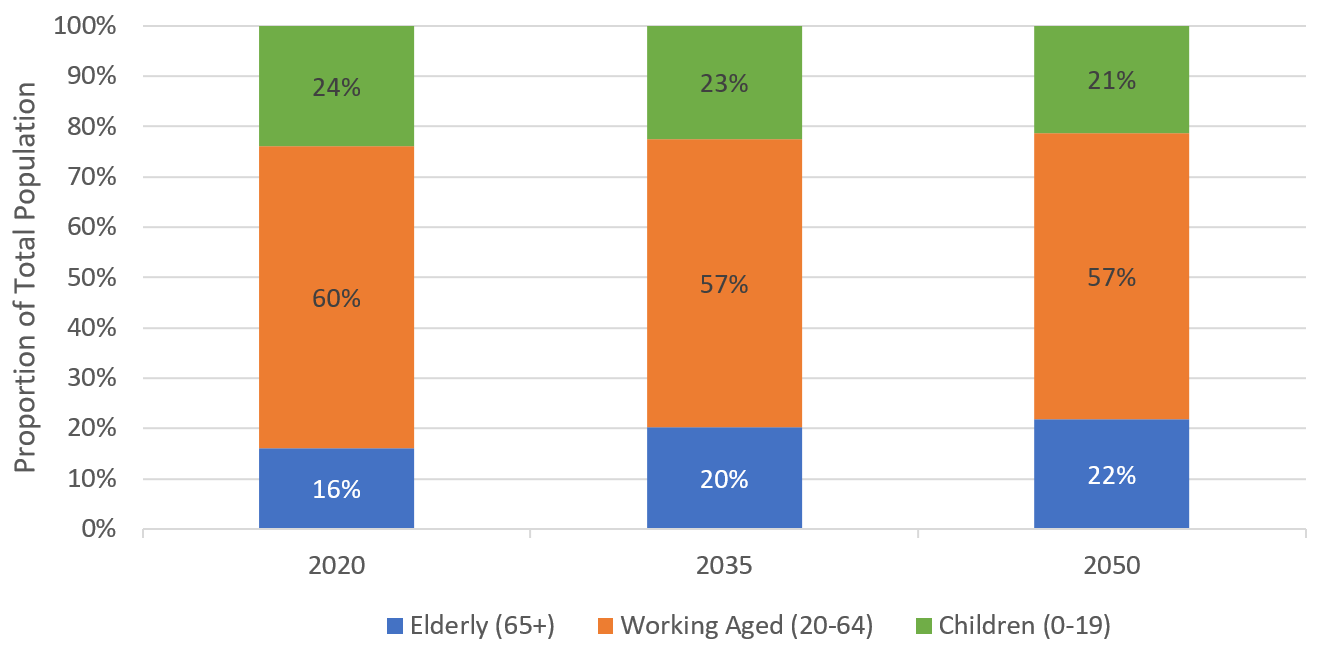
Source: Hauer, M. E. (2019). Population projections for U.S. counties by age, sex, and race controlled to shared socioeconomic pathway. Scientific data, 6, 190005. Data available at: https://osf.io/9ynfc/
[1] United States Census Bureau. QuickFacts. Available at: https://www.census.gov/programs-surveys/sis/resources/data-tools/quickfacts.html.
Projected Cumulative Growth and Distribution by Age Group
The growth in the elderly population is expected to outpace the child and working adult populations in every county during the coming decades (Figures 10a–10c).
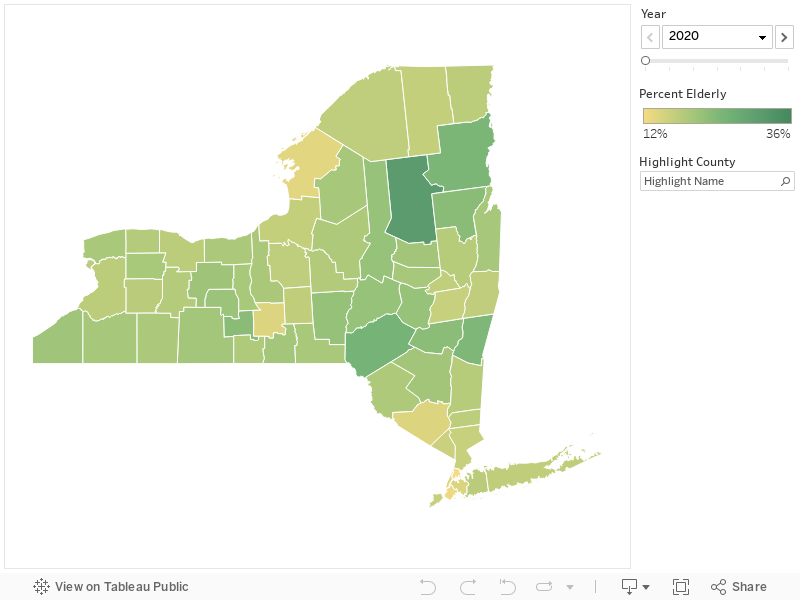
According to the most recent U.S. Census estimates, the elderly proportion of county populations across the State ranged from approximately 12.8% in Bronx County to 31.3% in Hamilton County.[1] The elderly proportion of the population is expected to increase in every county during the projection period (Figure 11c). By 2035, the elderly proportion will increase between 2 percentage points and 8 percentage points in every county. In contrast, the vast majority of counties will experience a decrease in the proportions of both children and working-age people (Figures 11a and 11b).
Many counties in and around New York City—such as Bronx, Kings, Queens, Suffolk, and Westchester Counties—currently have low proportions of elderly populations, but will have relatively high growth in the elderly population in the coming decades.
Figure 10a. Projected Cumulative Growth in the Child Population for Each County in New York State: 2020–2050 (5-year intervals)
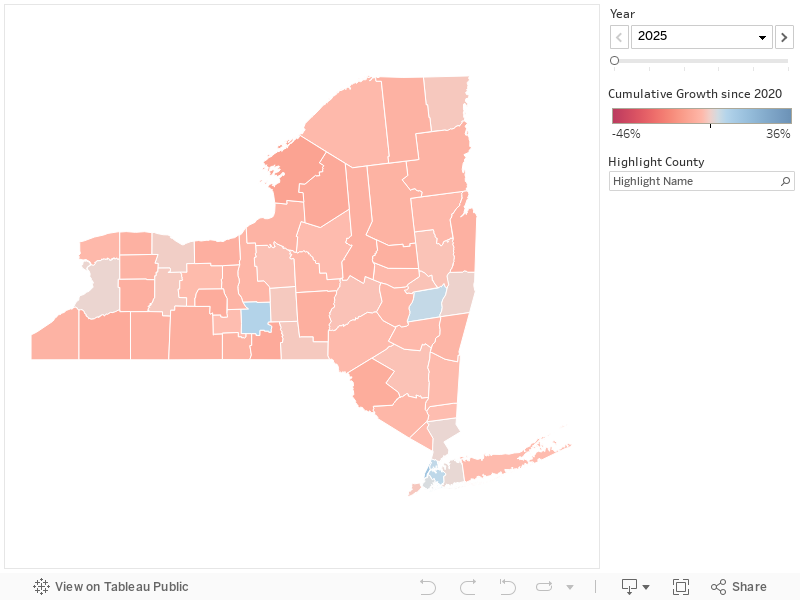
Figure 10b. Projected Cumulative Growth in the Working-Age Population for Each County in New York State: 2020–2050 (5-year intervals)
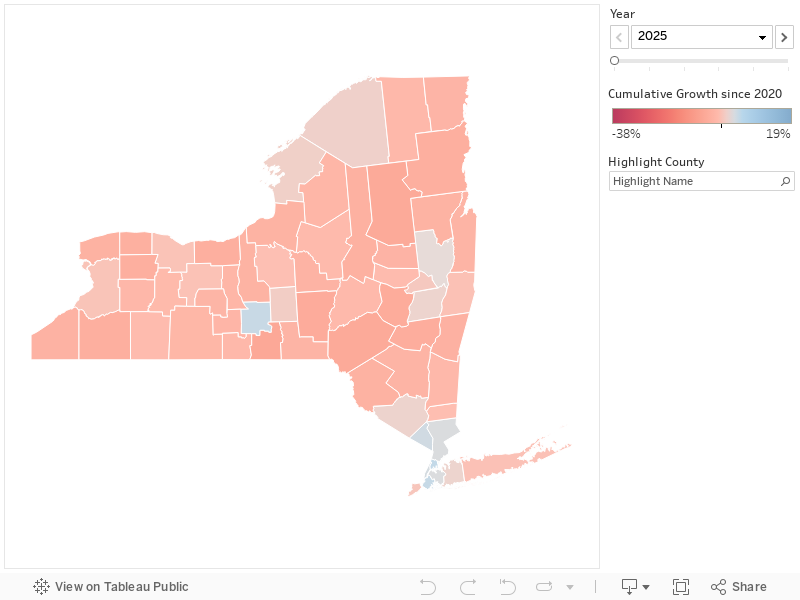
Figure 10c. Projected Cumulative Growth in the Elderly Population for Each County in New York State: 2020–2050 (5-year intervals)
Source: Hauer, M. E. (2019). Population projections for U.S. counties by age, sex, and race controlled to shared socioeconomic pathway. Scientific data, 6, 190005. Data available at: https://osf.io/9ynfc/
Figure 11a. Projected Distribution of Child Population for Each County in New York State: 2020–2050 (5-year intervals)
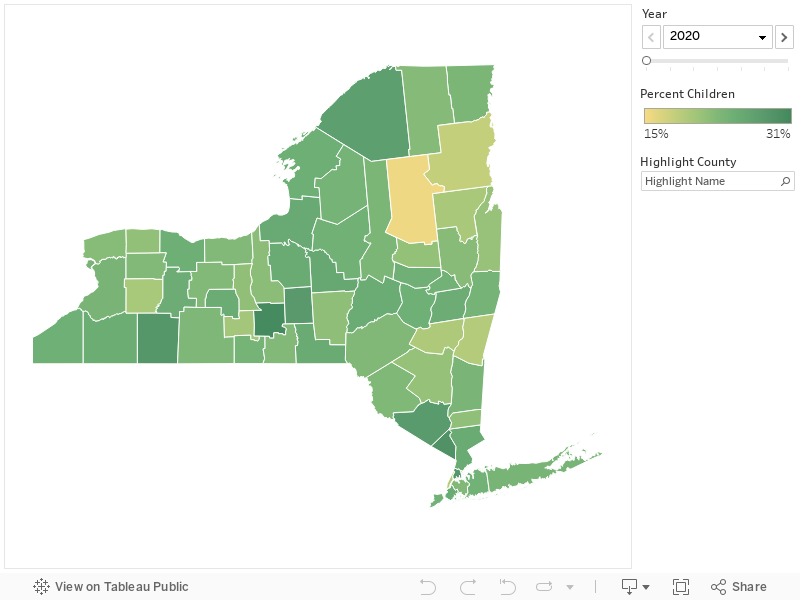
Figure 11b. Projected Distribution of Working-Age Population for Each County in New York State: 2020–2050 (5-year intervals)
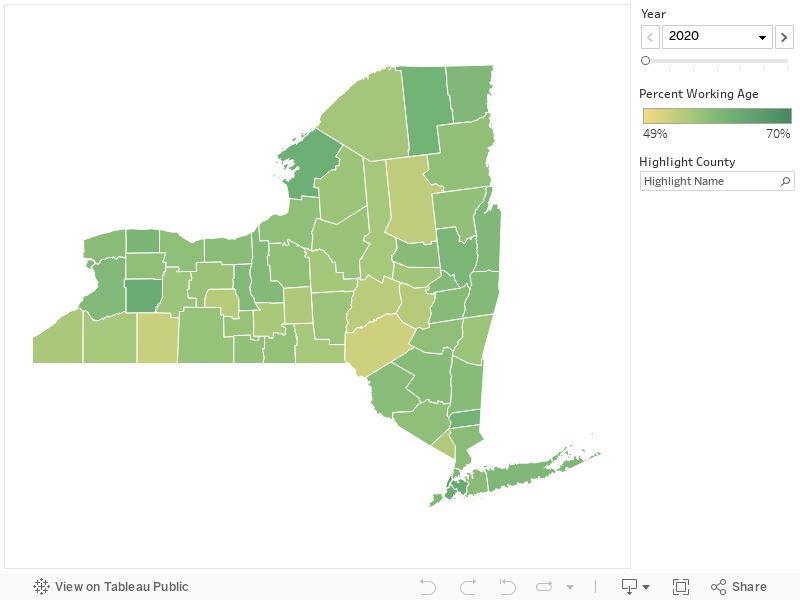
Figure 11c. Projected Distribution of Elderly Population for Each County in New York State: 2020–2050 (5-year intervals)
Source: Hauer, M. E. (2019). Population projections for U.S. counties by age, sex, and race controlled to shared socioeconomic pathway. Scientific data, 6, 190005. Data available at: https://osf.io/9ynfc/
[1] United States Census Bureau. QuickFacts. Available at: https://www.census.gov/programs-surveys/sis/resources/data-tools/quickfacts.html. (Latest year of county-level data available is for 2018.)
Distribution of Elderly Population in Rural and Urban Areas
Older adults disproportionately reside in less urban areas. That trend will continue, as the relative size of the elderly population is expected to increase across all counties throughout New York State. The Rural-Urban Continuum Codes (RUCCs) developed by the U.S. Department of Agriculture designate each county’s degree of urbanization and adjacency to a metro area. In 2018, the proportion of the population that is elderly in designated metro counties ranged from 16% to 18% (Table 1). In contrast, the proportion ranged from 17% to 31% for non-metro areas. These ranges are expected to increase to between 20% and 22% for metro areas and between 23% and 34% for non-metro areas by 2035.
Table 1. Proportion of Elderly Population in Rural and Urban Areas across New York State: 2018 and 2035
|
Rural-Urban Continuum Category |
Number of Counties |
2018 |
Proportion of Population 65 years or older | |
| 2018 Actual |
2035 Projected |
|||
| Metro areas of 1 million population or more | 20 | 15,507,286 | 16% | 20% |
| Metro areas of 250,000 to 1 million population | 12 | 2,065,300 | 18% | 22% |
| Metro areas of fewer than 250,000 population | 6 | 602,863 | 18% | 22% |
| Nonmetro areas of 20,000 population or more, adjacent to a metro area | 10 | 769,645 | 19% | 24% |
| Nonmetro areas of 20,000 population or more, not adjacent to a metro area | 1 | 80,695 | 17% | 23% |
| Nonmetro areas of 2,500 to 19,999 population, adjacent to a metro area | 9 | 355,514 | 22% | 27% |
| Nonmetro areas of 2,500 to 19,999 population, not adjacent to a metro area | 3 | 156,472 | 19% | 23% |
| Nonmetro areas of up to 2,500 population, adjacent to a metro area | 1 | 4,434 | 31% | 34% |
Source. Rural-Urban Continuum Codes are available from the United State Department of Agriculture at: https://www.ers.usda.gov/data-products/rural-urban-continuum-codes.aspx. 2018 population estimates are available from: United States Census Bureau. QuickFacts. Available at: https://www.census.gov/programs-surveys/sis/resources/data-tools/quickfacts.html. Population projections are available at: Hauer, M. E. (2019). Population projections for U.S. counties by age, sex, and race controlled to shared socioeconomic pathway. Scientific data, 6, 190005. Data available at: https://osf.io/9ynfc/.
Addressing Disparities in Health Care by Race and Ethnicity
Implications for the Health Care System
Even without a large increase in the overall population of New York State, the shift in the distribution of the population by age and race/ethnicity will substantially change the demand for health care for most counties in the State. To adequately meet the health care needs of a more diverse and elderly population, State and local health leaders will need to consider many interventions, including retraining the health care workforce, recruiting more physicians and other health care professionals, and determining more efficient ways to finance the health care system.
Addressing Disparities in Health Care by Race and Ethnicity
Research has documented wide disparities in health and health care by race and ethnicity. For example, minorities in New York State have been more likely to suffer premature death, less likely to have a regular source of health care, and less likely to be covered by health insurance.[1] Without improving the way care is delivered to disadvantaged racial and ethnic groups, these disparities will only become more pronounced, particularly for the counties with larger minority populations, such as those in and around New York City.
Multiple factors contribute to the worse health of minority groups. Socioeconomic disadvantages at the individual level (e.g., lower income, job status, and education) and neighborhood level (e.g., less access to transportation and nutritious food) undoubtedly play an important role. However, research has shown that significant disparities in the quality and outcomes of health care exist even after controlling for differences in socioeconomic factors, as well as preexisting health conditions. This is exemplified by persistent disparities in maternal mortality and morbidity (deaths or complications related to pregnancy and childbirth). In New York City, where the State’s minority population is concentrated, the rate of severe maternal morbidity for Black women has been found to be up to three times higher than that of white women, even after stratifying by neighborhood poverty, low education, and pre-pregnancy obesity.[2] Similar patterns of disparities in severe maternal morbidity for minority women exist statewide.[3]
One of the lurking factors driving these continued disparities is racial bias in the health care system. A large and growing body of literature documents how biases that exist outside of the health care system are also exhibited by health care professionals.[4] These implicit racial biases are associated with less accurate diagnoses, curtailed treatment options, less pain management, and worse clinical outcomes, such as increased severe maternal morbidity, for minority patients.[5]
Addressing racial and ethnic disparities will require a multi-pronged approach. Several interventions have been recommended, including:
Conducting implicit bias training. Incorporating implicit bias training into medical schools and other training programs will enable the health care workforce to be better attuned to their racial biases and equipped with skills and tactics to address them.[6]
Building and recruiting a more diverse health care workforce. New York’s physicians are less racially and ethnically diverse than the State’s population.[7] A more culturally diverse health care workforce that better matches the demographics of patients can help ensure that there are clinicians who are fluent in their patients’ languages, as well as the broader context of their cultural and socioeconomic conditions.
Ensuring more diversity in health system leadership. Greater diversity among health system executives can help ensure health equity remains high on the quality improvement agenda, while also exhibiting credibility to execute on that goal.[8]
Building a multi-lingual capacity. Implementing basic standards in health systems for interpreters and translation services can also help address the language gaps. This intervention can be achieved more immediately, relative to substantially changing the racial and ethnic mix of the workforce.[9]
Improving measurement and reporting on racial disparities. Measurement is needed to recognize existing disparities, ensure accountability, and identify the most appropriate interventions.[10]
Addressing socioeconomic inequities. Social and economic factors outside of the health care system play a vital role in people’s health. Hence, policies regarding employment, education, housing, transportation, public infrastructure (e.g., park spaces), and food insecurity can make a large impact on reducing disparities.
When developing solutions, it will be critical for State and local policy leaders to recognize that one size does not fit all. The way that different groups interact with the health care system, as well as their needs, can vary substantially between and within racial and ethnic categories. For example, the Hispanic population has been associated with higher rates of asthma and other lung diseases relative to State averages, as well as higher rates of emergency department use that is indicative of not having a usual source of care.[11] Along with higher asthma rates, the Black population has been associated with relatively higher rates of heart disease, cancer, and diabetes.[12] Hence, counties such as Niagara and Rensselaer, which are expected to have more than 50% growth in their Hispanic populations by 2035, will require different interventions than counties such as Putnam and Allegany, which are projected to have much higher growth in their Black populations. Moreover, it is likely that the socioeconomic conditions of each county will be different, which can also influence the interventions needed.
[1] New York State Department of Health. Prevention Agenda Dashboard: Improve Health Status and Reduce Health Disparities. Available at: https://webbi1.health.ny.gov/SASStoredProcess/guest?_program=/EBI/PHIG/apps/dashboard/pa_dashboard&p=sh.
[2] New York City Department of Health and Mental Hygiene. New York City 2008-2012: Severe Maternal Morbidity. Available at: https://www1.nyc.gov/assets/doh/downloads/pdf/data/maternal-morbidity-report-08-12.pdf
[3] Kacica, M. Jun 27, 2018 Presentation. New York State Maternal Mortality and Morbidity. Available at: https://www.health.ny.gov/community/adults/women/task_force_maternal_mortality/docs/meeting1/2018-06-26_kacica_mmr_taskforce.pdf
[4] FitzGerald, C., Hurst, S. Implicit bias in healthcare professionals: a systematic review. BMC Med Ethics 18, 19 (2017). Available at: https://bmcmedethics.biomedcentral.com/articles/10.1186/s12910-017-0179-8.
[5] Agrawal S & Enekwechi A. 2020. It’s Time To Address The Role Of Implicit Bias Within Health Care Delivery> Health Affairs. Available at: https://www.healthaffairs.org/do/10.1377/hblog20200108.34515/full/.
[6] Agrawal S & Enekwechi A. 2020. It’s Time To Address The Role Of Implicit Bias Within Health Care Delivery> Health Affairs. Available at: https://www.healthaffairs.org/do/10.1377/hblog20200108.34515/full/.
[7] Center for Health Workforce Studies. 2017. Trends in Health Professions Diversity in New York: Medicine, Dentistry, and Nursing. Available at: https://www.chwsny.org/wp-content/uploads/2017/05/NY_Race_Ethnicity_Brief_2017.pdf.
[8] Herrin, J., Harris, K. G., Spatz, E., Cobbs-Lomax, D., Allen, S., & León, T. (2018). Hospital Leadership Diversity and Strategies to Advance Health Equity. The Joint Commission Journal on Quality and Patient Safety, 44(9), 545-551.
[9] Agency for Healthcare Research and Quality. AHRQ Health Literacy Universal Precautions Toolkit, Second Edition. Address Language Differences: Tool #9. Available at https://www.ahrq.gov/health-literacy/quality-resources/tools/literacy-toolkit/healthlittoolkit2-tool9.html.
[10] Agrawal S & Enekwechi A. 2020. It’s Time To Address The Role Of Implicit Bias Within Health Care Delivery> Health Affairs. Available at: https://www.healthaffairs.org/do/10.1377/hblog20200108.34515/full/.
[11] The New York Health Foundation. https://nyhealthfoundation.org/wp-content/uploads/2018/04/local-approaches-to-improve-neighhorhood-health-april-2018.pdf; New York State Department of Health. New York State Health Equity Report, 2019. Available at: https://www.health.ny.gov/community/minority/docs/health_equity_report_2019.pdf.
[12] New York State Department of Health. New York State Health Equity Report, 2019. Available at: https://www.health.ny.gov/community/minority/docs/health_equity_report_2019.pdf.
Building Capacity for the Elderly
Implications for the Health Care System
Even without a large increase in the overall population of New York State, the shift in the distribution of the population by age and race/ethnicity will substantially change the demand for health care for most counties in the State. To adequately meet the health care needs of a more diverse and elderly population, State and local health leaders will need to consider many interventions, including retraining the health care workforce, recruiting more physicians and other health care professionals, and determining more efficient ways to finance the health care system.
Building Capacity for the Elderly
The aging of the population will have an unprecedented impact on the health care system. The elderly consume a disproportionate share of health care services; aged enrollees in the New York Medicaid program have been shown to consume well over twice as much health care as the average enrollee in terms of total spending.[1] Meanwhile, as the population demands more health care, the supply of health care will dwindle as an increasing number of health care workers age and retire. [2]
As with the racial and ethnic diversification of the population, the aging of the population will require changes in the nature of the skills and services that the health care workforce must be equipped to provide, as well as the settings in which care is provided. This will likely include an increase in the amount of formal nursing home and home health care provided, as well as informal home care delivered by family caretakers. A major challenge to meeting the increased demand for health care is the persistent shortage of health care professionals. Many nursing homes and home health agencies in the State already report difficulties recruiting registered nurses and other health care professionals.[3]
The shortage is more problematic in rural and non-metro areas such Schuyler, Hamilton, Greene, Essex, Delaware, and Chenango counties, in which more than one in five residents are age 65 or older. Rural and non-metro areas face multiple challenges: they are disproportionately populated with seniors, health care providers are more likely to be in short supply, and there is less likely to be a robust public transportation system available. [4] Many of those counties are located in health professional shortage areas for primary care and other specialties, particularly in New York State’s North Country (which includes Hamilton and Essex counties) and Southern Tier (which includes Chenango and Delaware counties) regions.[5] State and local health care leaders will need to strategize how to recruit more health care professionals in rural and non-metro counties.
Health care quality has also long been an issue within long-term care facilities. As the elderly population increases, it will become increasingly critical for State and local health care leaders to have better information about quality available to seniors and their family members. Additionally, patient advocacy programs like the Long-Term Care Ombudsman Program will need to be expanded to accommodate the growing population of seniors. Among other duties, ombudspeople identify and resolve complaints made by or on behalf of residents living in nursing homes and other long-term care facilities. It has been reported that several counties in the Mid-Hudson region (including Orange, Dutchess, Ulster, Sullivan, Greene, and Columbia counties) lack both volunteer and full-time paid ombudspeople; similar shortages exist throughout the State.[6]
Payment models for long-term care will also likely require reform, as many seniors struggle to finance long-term care. Moreover, a large part of the State’s existing budget constraints due to the Medicaid program are largely attributable to the programs aiming to help with the medical and functional needs of the elderly. The New York Medicaid Managed Long-term Care program more than tripled in enrollment from 2012 through 2019.[7] These budget issues will make it increasingly critical in future years to figure out how to deliver more efficient care to elderly New Yorkers.
[1] Kaiser Family Foundation. State Health Facts. Available at: https://www.kff.org/medicaid/state-indicator/medicaid-spending-per-enrollee/?currentTimeframe=0&sortModel=%7B%22colId%22:%22Location%22,%22sort%22:%22asc%22%7D
[2] Center for Health Workforce Studies. 2018. The Health Care Workforce in New York: Trends in the Supply of and Demand for Health Workers. Available at: https://www.chwsny.org/wp-content/uploads/2018/04/Full_CHWS_NY_Tracking_Report-2018b-1.pdf.
[3] Center for Health Workforce Studies. 2018. The Health Care Workforce in New York: Trends in the Supply of and Demand for Health Workers. Available at: https://www.chwsny.org/wp-content/uploads/2018/04/Full_CHWS_NY_Tracking_Report-2018b-1.pdf.
[4] Center for Health Workforce Studies. 2018. The Health Care Workforce in New York Trends in the Supply of and Demand for Health Workers. Available at: http://nyachnyc.org/wp-content/uploads/2018/04/CHWS-The-HC-Workforce-in-NY-2018.pdf.
[5] Center for Health Workforce Studies. 2018. The Health Care Workforce in New York Trends in the Supply of and Demand for Health Workers. Available at: http://nyachnyc.org/wp-content/uploads/2018/04/CHWS-The-HC-Workforce-in-NY-2018.pdf.
[6] Axelrod D. October 11, 2019. Patient advocates in short supply at long-term care facilities. Times Herald-Record. Available at: https://www.recordonline.com/news/20191011/state-patient-advocates-in-short-supply-at-long-term-care-facilities.
[7] New York State Department of Health. Monthly Medicaid Managed Care Enrollment reports. Available at: https://www.health.ny.gov/health_care/managed_care/reports/enrollment/monthly/.
Conclusion
Health policy experts have been sounding the alarm over the demographic shifts in the population for decades. Over the coming years, these shifts will be gaining speed in many parts of the State. The county-level projections by race/ethnicity and age can be used by State and local policymakers and health care leaders to better target interventions in order to prepare for associated increases in demand for health care. Additionally, the projections give New York the opportunity to close existing disparities in health care for minority populations and proactively prevent new ones from forming.
Data & Limitations
Data
The projections are based on work conducted at Florida State University. The full methods are described and available at:
- Source: Hauer, M. E. (2019). Population projections for U.S. counties by age, sex, and race controlled to shared socioeconomic pathway. Scientific data, 6, 190005.
The data for all counties in the United State are available at: https://osf.io/9ynfc/.
Note that projections are made out to 2100; however, projection estimates are only displayed in this brief through 2050.
Limitations
Population projections, particularly those with a long-term outlook, are subject to uncertainty. Hence, a range of projection scenarios based on more and less optimistic assumptions are often modeled, as was conducted in this case.[1]
Part of the reason for the uncertainty is that future trends are predicted based upon historical trends. To the degree to which “novel” events (e.g., new and unforeseen immigration policies, climate change events, pandemics, wars, unprecedented economic growth) occur in the future, there is likely to be divergence from historical patterns. Already, we see potential divergence for New York from the most-likely scenario that was modeled. According to the most recent years of Census survey data, there was a net out-migration of New Yorkers in recent years, which was not captured in the historical years of data were used to base the projections. This has led to a likely lower than projected total population in New York State in 2020 (according to the “Middle of the Road” option). Moreover, the COVID-19 pandemic in 2020 will also impact demographic distributions, and potentially even the population sizes in more metro versus nonmetro areas.
Because of the uncertainty involved in accurately predicting population levels, we focus on the growth rates in the projections, as well as the potential impacts on the distributions of the population by race and gender. Likewise, because uncertainty in the forecasts increases the further in the future any projection model tries to project, we focus on the estimates in the nearer-term. Although accurately predicting levels is extremely difficult, projection models are generally useful in understanding directional impacts as reflected by growth rates and distributional changes.